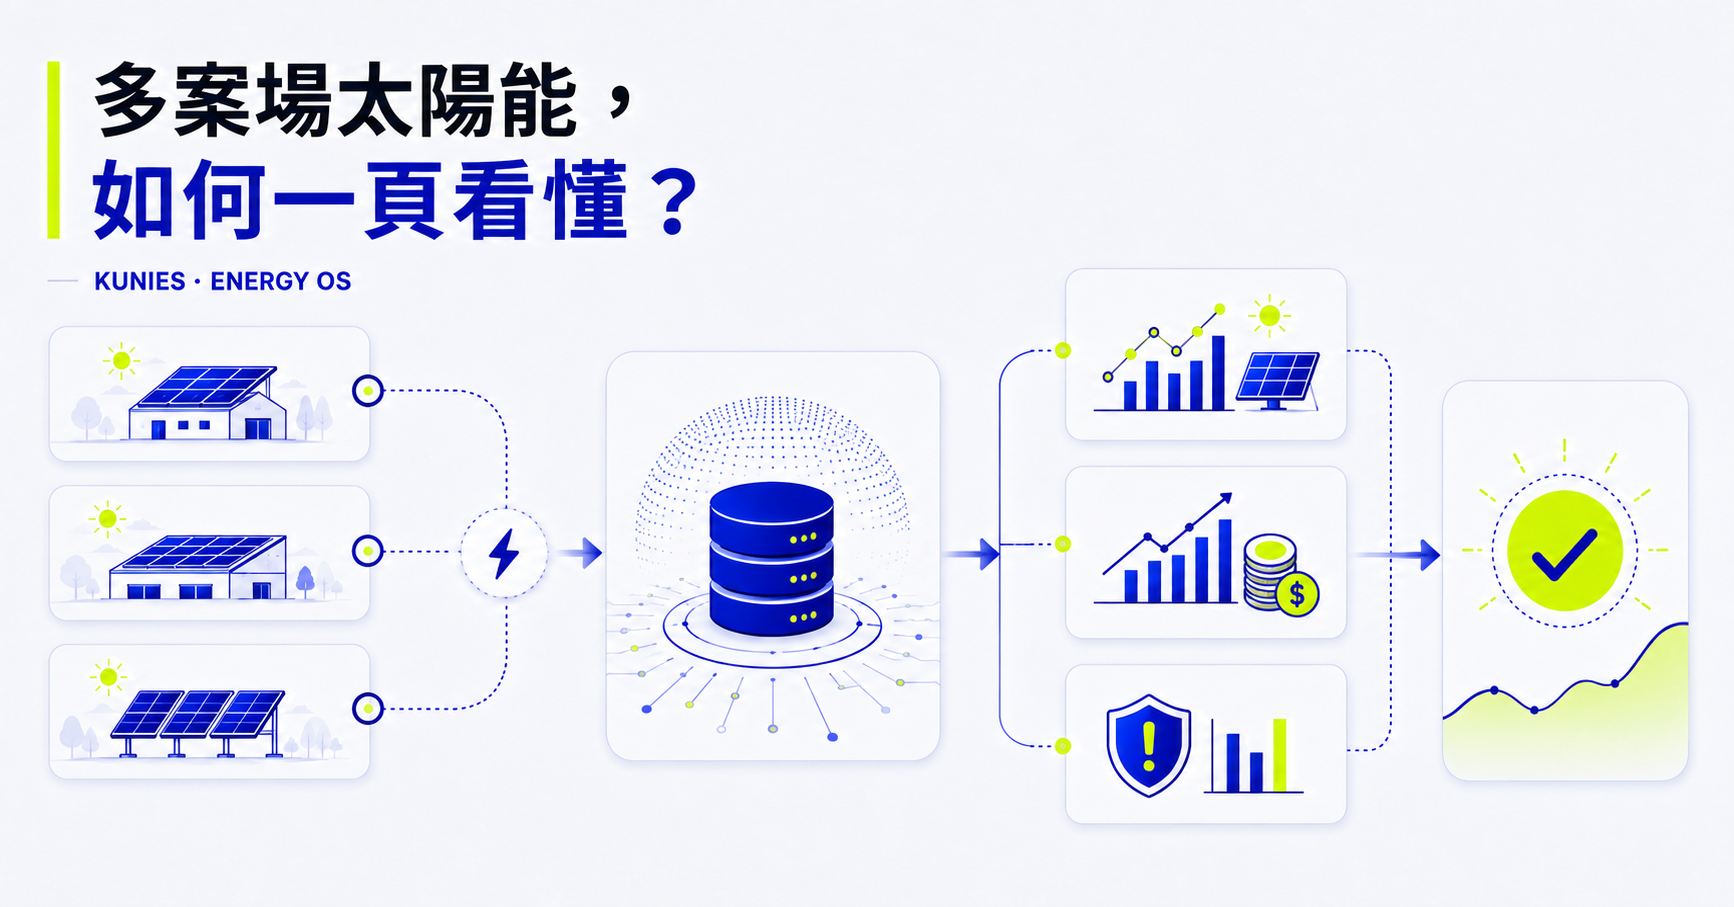
Multi-Site Solar Asset Management: One Decision Page for Production, Revenue, and Risk
As a portfolio grows, the challenge is no longer seeing data. It is comparing sites on one basis, translating exceptions into financial impact, and showing engineering and investment teams what to address first.
Key terms
11 terms used in this guide, kept within a 20-term reading limit.
- Portfolio
- A group of sites or assets managed as one investment set.
- Installed capacity
- Rated generation capability under standard conditions.
- Actual production
- Energy measured during a defined period.
- Expected production
- Reasonable generation estimated from capacity, weather, and equipment conditions.
- PR
- A performance ratio that adjusts for the amount of solar resource.
- Availability
- The share of required operating time in which equipment can run.
- Revenue gap
- The difference between reasonably expected and actual revenue.
- Data quality
- Whether data is complete, timely, consistent, and traceable.
- Baseline
- A common calculation basis used for fair comparison.
- Event
- A traceable condition that changes production, cost, or revenue.
- Prioritization
- Ranking action by value, risk, confidence, and cost.
The purpose of a one-page report is not more numbers
An asset manager needs to know which site is off plan, how much value is affected, whether the diagnosis is credible, and who owns the next action. The first page should retain only decision-driving metrics, while equipment detail remains available for investigation.
- Actual and expected portfolio generation
- Verified revenue gap for the period
- The top three sites requiring action
- Missing data or unresolved contract issues
- Owner, due date, and action status
Research note: If a report describes the situation without triggering a decision, it remains a monitoring screen.
Normalize names, time, and calculation boundaries first
Sites may use different equipment vendors, service providers, meters, and naming rules. A shared asset model aligns identifiers, time zones, intervals, units, capacity definitions, and contract versions without discarding source evidence.
- Assign unique identifiers to sites, equipment, meters, and contracts
- Normalize time zones, intervals, and engineering units
- Version capacity and contract effective dates
- Mark missing, delayed, and manually changed data
Research note: A clean chart is not proof of correct data; each result should trace back to its source.
Fair comparison removes weather and scale differences
Large sites naturally generate more, and sunny days outperform rainy ones. Portfolio ranking should first adjust for installed capacity and concurrent weather, then use PR, availability, and event evidence to separate weather from actionable loss.
- Check data completeness before performance
- Use the same period and formula across sites
- Separate outages, derating, soiling, and grid events
- Avoid making long-term judgments from one-day rankings
Research note: No single KPI describes asset health; indicators must be read with events and data quality.
Translate production variance into revenue and risk
The same energy loss can have different financial effects under different prices, contracts, and settlement periods. A useful report connects verified production variance to the effective commercial terms and distinguishes recoverable value from unresolved risk.
- Reference the correct contract version
- Separate estimates from settled amounts
- Retain the event, formula, and data source
- Rank value together with confidence and action cost
Research note: A high-value event with weak evidence may need data work first; a moderate event with a quick fix may deserve earlier action.
AI finds exceptions; people make the decision
AI can identify equipment outside a normal range, group repeated alarms, and estimate expected generation across many sites. Results should show confidence and link to source data. Repairs, claims, and capital decisions still require accountable review.
- Attach time, asset, and baseline to each exception
- Group repeated alarms into actionable events
- Route low-confidence results to investigation
- Verify improvement using actual production and revenue
Research note: AI creates value when it shortens the path from detection to verified action.
Start with three sites and a four-week rhythm
A team does not need to integrate the whole portfolio at once. Select three sites with different data conditions, establish a minimum workflow, and expand only after the report is used in real decisions.
- Week 1: inventory data, contracts, and owners
- Week 2: normalize metrics and check data quality
- Week 3: verify major losses and top actions
- Week 4: track outcomes and establish a weekly review
Research sources
These sources support the market context and operating methods in this guide. Project decisions should use current local rules, contracts, and engineering evidence.